Abstract
The Liberal Party won the 2019 federal election. In the study, we explore the ces2019 phone survey data set. We found out that the survey result actually favor on the Conservative Party
Introduction
We use Wickham et al. (2019), R Core Team (2020), Allaire et al. (2020), Wickham, Hester, and Chang (2020), Hodgetts and Alexander (2020), Xie (2020)
The Canadian Liberal Party won the 2019 Federal Election by getting 46.4% seats and 33.1% votes (Elections Canada, 2019).In this study, we are interested at finding the supporting rate of Liberal Party in the ces2019_phone survey. We look at how well the ces2019_phone survey can predict the Federal Election. More importantly, we want to see did this survey obtain a sufficient sample to represent the entire voter population.
In this study, we construct tables and graphs to see which party the survey participants are likely to vote for. Surprisingly, we found out that more participants are willing to vote for the Conservative Party rather than the Liberal Party. There are only about 22.6% of the survey participants are likely to vote for Liberal Party. By comparing with the federal election result, which is the Liberal Party won 33.1% of the votes. We can see that the result is not very accurate. The collected sample of this survey is not sufficient enough to represent the entire voters’ actions.
In the following, we provide some of the data from the survey. By manipulating the data set, we construct several tables and graphs along with 4 findings. Later we look at some of the weaknesses and the further work we can work on.
Data
This is the raw data set from the ces2019_phone survey
## TO CITE THIS SURVEY FILE:
##
## - Stephenson, Laura B; Harell, Allison; Rubenson, Daniel; Loewen, Peter John, 2020, '2019 Canadian Election Study - Phone Survey', https://doi.org/10.7910/DVN/8RHLG1, Harvard Dataverse, V1, UNF:6:eyR28qaoYlHj9qwPWZmmVQ== [fileUNF]
##
## - Stephenson, Laura, Allison Harrel, Daniel Rubenson and Peter Loewen. Forthcoming. 'Measuring Preferences and Behaviour in the 2019 Canadian Election Study,' Canadian Journal of Political Science.
##
## LINK: https://dataverse.harvard.edu/dataset.xhtml?persistentId=doi:10.7910/DVN/8RHLG1
## # A tibble: 4,021 x 2
##              q3                                                              q11
##       <dbl+lbl>                                                        <dbl+lbl>
##  1 1 [(1) Male] -9 [(-9) Don't know / Undecided]
##  2 1 [(1) Male] -9 [(-9) Don't know / Undecided]
##  3 1 [(1) Male]  1 [(1) Liberal (Grits)]
##  4 1 [(1) Male]  4 [(4) Bloc Québécois (BQ, PQ, Bloc, Parti Québécois)]
##  5 1 [(1) Male]  3 [(3) NDP (New Democratic Party, New Democrats, NDPers)]
##  6 1 [(1) Male]  4 [(4) Bloc Québécois (BQ, PQ, Bloc, Parti Québécois)]
##  7 1 [(1) Male]  5 [(5) Green Party (Greens)]
##  8 1 [(1) Male]  4 [(4) Bloc Québécois (BQ, PQ, Bloc, Parti Québécois)]
##  9 1 [(1) Male]  2 [(2) Conservatives (Tory, PCs, Conservative Party of Canada)]
## 10 1 [(1) Male] -9 [(-9) Don't know / Undecided]
## # … with 4,011 more rows
The variables we focus on are q3(Gender) and q11(Which party will you likely to vote for). For q3, male denoted by 1; female denoted by 2 and others denoted by 3. For q11, -9 is “Don’t know”; -8 is “Refused”; 1 is “Liberal”; 2 is “conservatives; 3 is”NDP“; 4 is”Quebecois“; 5 is”Green“; 6 is”People“; 7 is”Other“; 9 is”None“; 10 is” Will spoil ballet
Finding #1
First, we split the data set by genders. We found out that only 1 participant choose others, the rest of the participants are distributed by male and female. From Figure 1., we see that the amount of male participants is a little bit more than the amount of female participants in this phone survey. There are about 56.5% of the survey participants are male and 43.5% of the survey participants are female.So it is reasonable to split the data set into male and female and study them separately. Later in the study, we will focus on male participants and female participants.
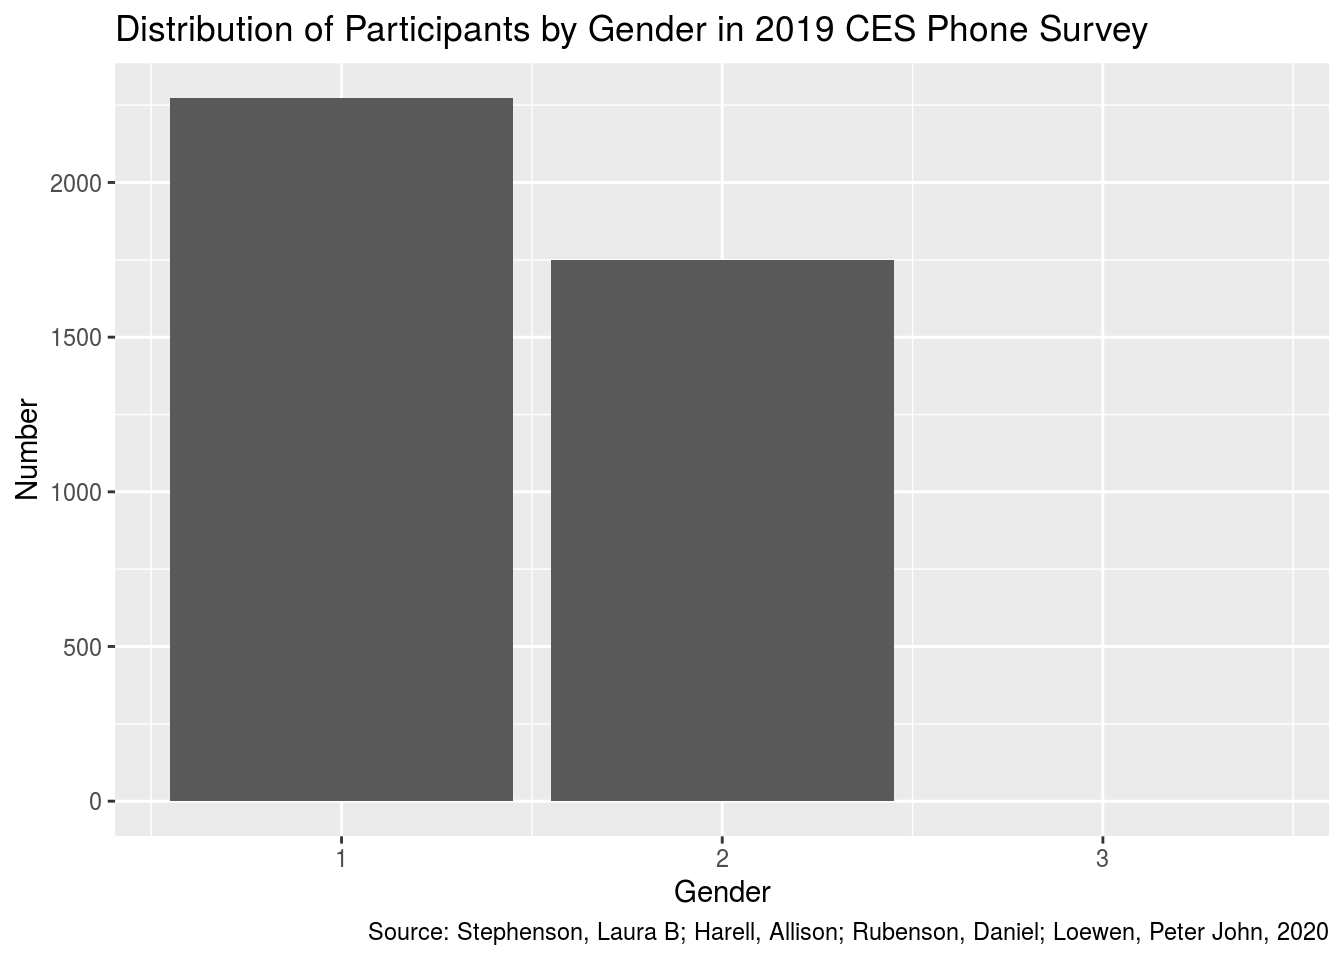
Figure 1: Figure 1. Distribution of Participants by Gender in 2019 CES Phone Survey
Finding #2
In this case, we look at male participants. From the Figure 2., the popular choice is actually 2(Conservative). We notice that there is only about 21.7% of male participants chose Liberal be the party they are likely to vote for, which is much less than the actual federal election result(33.1%).
## Which party will you likely to vote for
## # A tibble: 12 x 2
##                                                                vars     n
##                                                           <dbl+lbl> <int>
##  1 -9 [(-9) Don't know / Undecided]                                   474
##  2 -8 [(-8) Refused]                                                  125
##  3  1 [(1) Liberal (Grits)]                                           493
##  4  2 [(2) Conservatives (Tory, PCs, Conservative Party of Canada)]   656
##  5  3 [(3) NDP (New Democratic Party, New Democrats, NDPers)]         196
##  6  4 [(4) Bloc Québécois (BQ, PQ, Bloc, Parti Québécois)]             58
##  7  5 [(5) Green Party (Greens)]                                      159
##  8  6 [(6) People's Party]                                             32
##  9  7 [(7) Other]                                                      12
## 10  9 [(9) None of these]                                               9
## 11 10 [(10) Will spoil ballet]                                          4
## 12 NA                                                                  54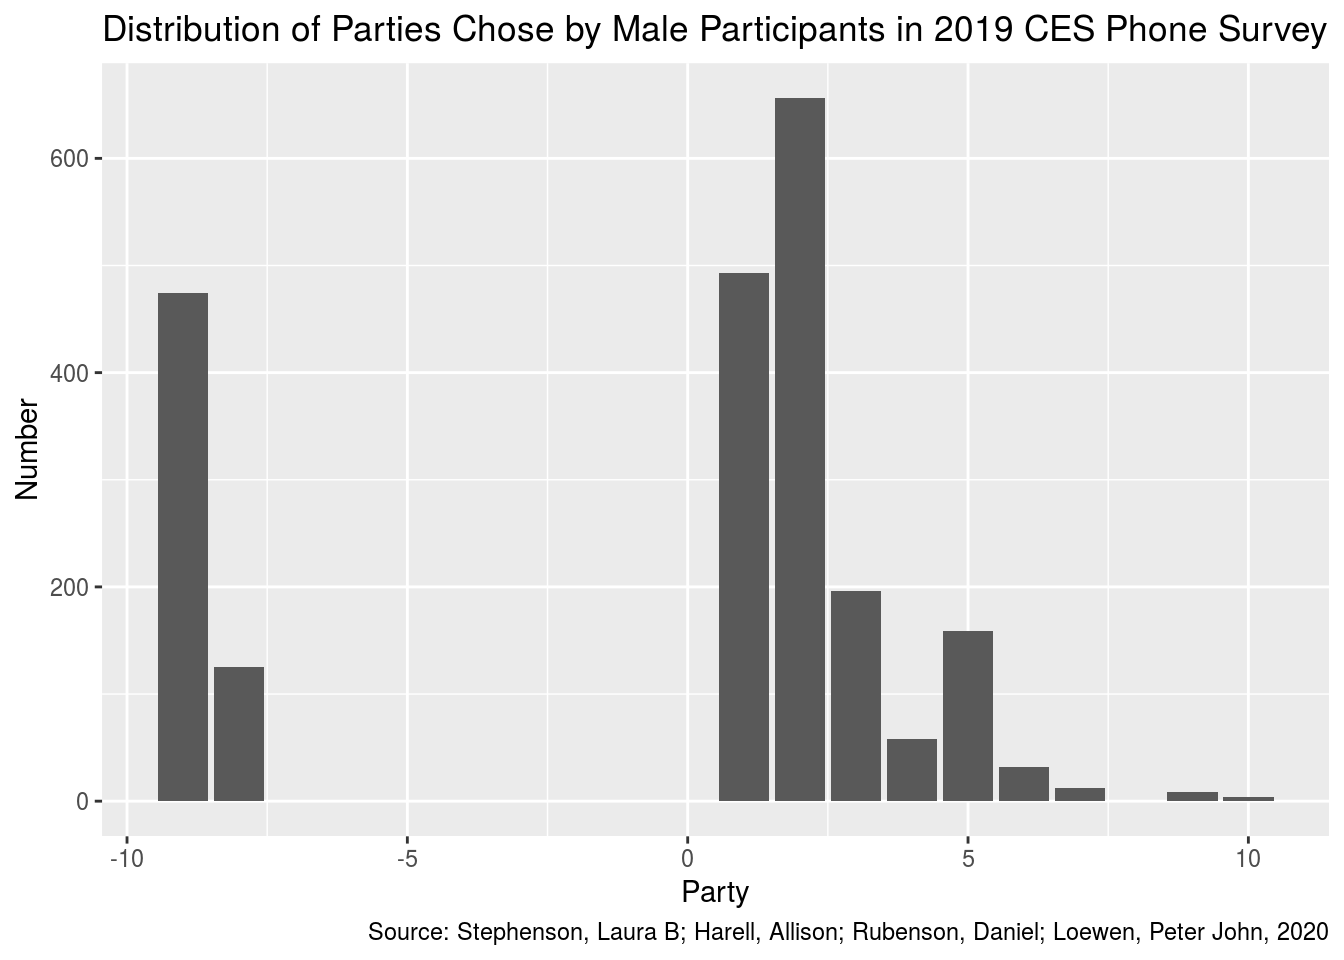
Figure 2: Figure 2. Distribution of Parties Chose by Male Participants in 2019 CES Phone Survey
Finding #3
Now we look at the female participants.From the Figure 3., we can see that most of the female participants chose -9(Don’t know). The second popular choice is 1(Liberal). However, there is only about 23.8% of them choose Liberal. This is still way below the actual federal election result(33.1%).
## Which party will you likely to vote for
## # A tibble: 13 x 2
##                                                                vars     n
##                                                           <dbl+lbl> <int>
##  1 -9 [(-9) Don't know / Undecided]                                   449
##  2 -8 [(-8) Refused]                                                  110
##  3  1 [(1) Liberal (Grits)]                                           416
##  4  2 [(2) Conservatives (Tory, PCs, Conservative Party of Canada)]   324
##  5  3 [(3) NDP (New Democratic Party, New Democrats, NDPers)]         208
##  6  4 [(4) Bloc Québécois (BQ, PQ, Bloc, Parti Québécois)]             40
##  7  5 [(5) Green Party (Greens)]                                      128
##  8  6 [(6) People's Party]                                             17
##  9  7 [(7) Other]                                                      12
## 10  8 [(8) Will not vote]                                               1
## 11  9 [(9) None of these]                                               8
## 12 10 [(10) Will spoil ballet]                                          5
## 13 NA                                                                  30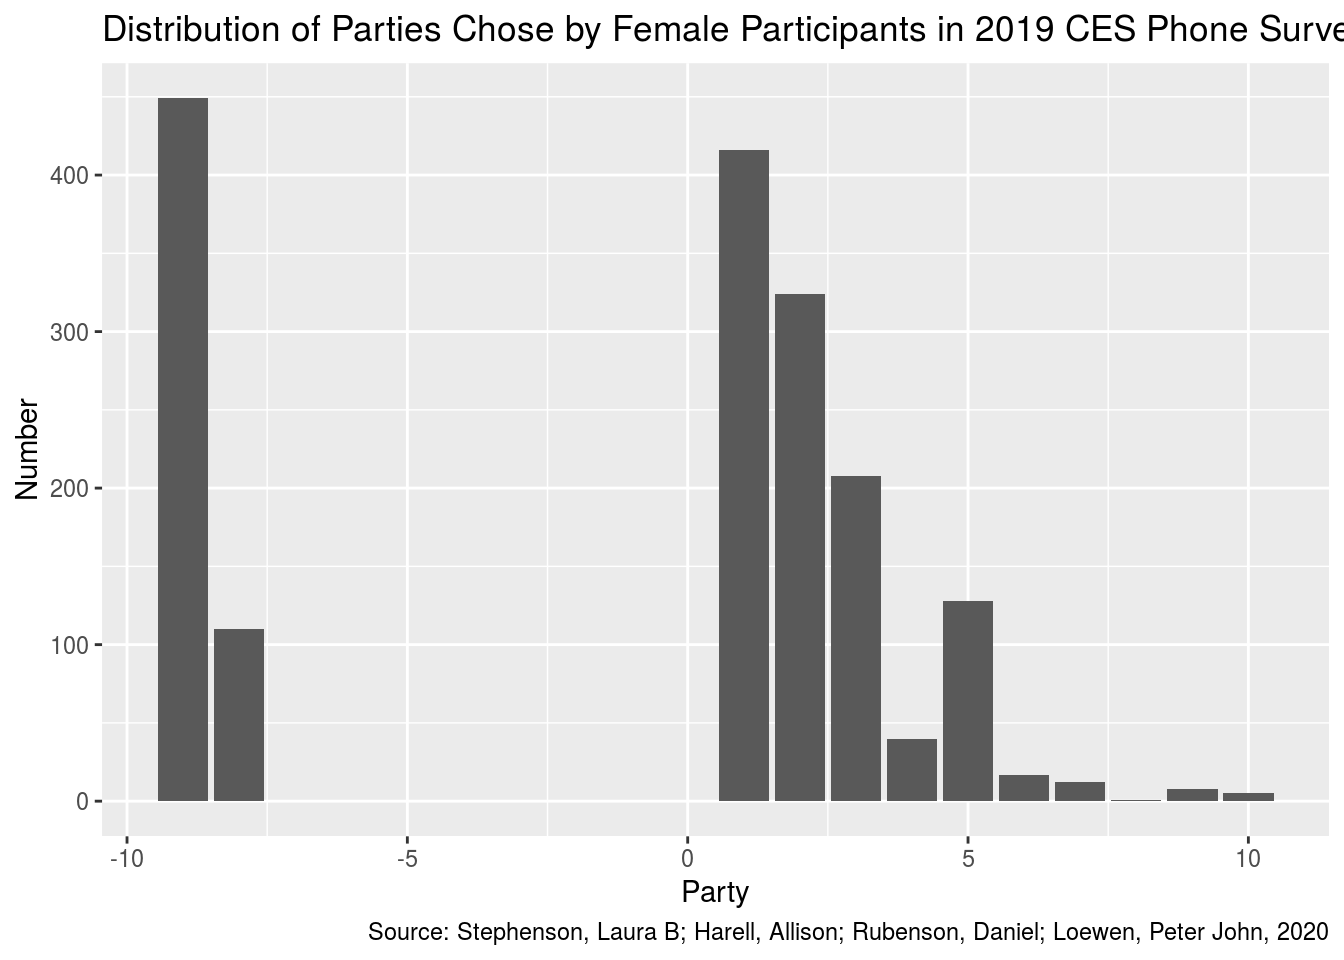
Figure 3: Figure 3. Distribution of Parties Chose by Female Participants in 2019 CES Phone Survey
Finding #4
Last but not least, we look at all the participants. From the Figure 4., we see that choice 2(Conservative) is a little more than choice 1(Liberal) due to larger amount of male participants. Unsurprisingly, there is only about 22.6% of the vote for Liberal Party. In this survey, we can only conclude that Conservative Party is more popular than Liberal Party.
## Which party will you likely to vote for
## # A tibble: 13 x 2
##                                                                vars     n
##                                                           <dbl+lbl> <int>
##  1 -9 [(-9) Don't know / Undecided]                                   923
##  2 -8 [(-8) Refused]                                                  235
##  3  1 [(1) Liberal (Grits)]                                           909
##  4  2 [(2) Conservatives (Tory, PCs, Conservative Party of Canada)]   980
##  5  3 [(3) NDP (New Democratic Party, New Democrats, NDPers)]         405
##  6  4 [(4) Bloc Québécois (BQ, PQ, Bloc, Parti Québécois)]             98
##  7  5 [(5) Green Party (Greens)]                                      287
##  8  6 [(6) People's Party]                                             49
##  9  7 [(7) Other]                                                      24
## 10  8 [(8) Will not vote]                                               1
## 11  9 [(9) None of these]                                              17
## 12 10 [(10) Will spoil ballet]                                          9
## 13 NA                                                                  84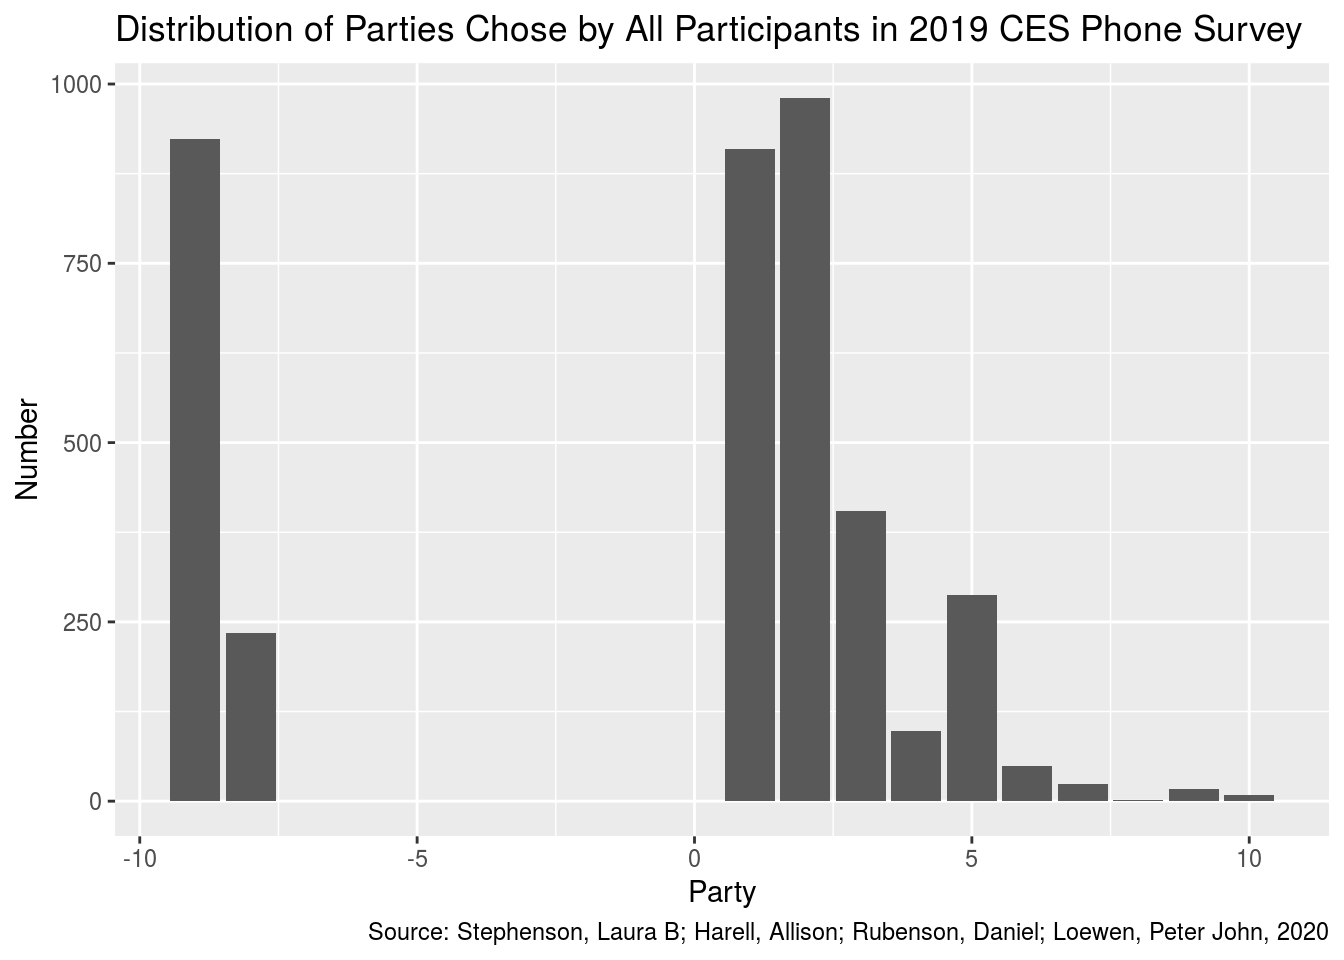
Figure 4: Figure 4. Distribution of Parties Chose by All Participants in 2019 CES Phone Survey
Discussion
The result of this survey shows Conservative Party is more popular than Liberal Party. There are only about 22.6% of the participants are willing to vote Liberal Party. By comparing with the federal election result(Liberal won the election with 33.1% of the votes), we can conclude that this survey result is not accurate. Indeed, the collected sample data is not representative for the voting population. Since this is a phone survey, there are large amount of people that don’t have cell phone or not familiar with phone survey became non-respondents. This non-response caused the result to be biased, and skewed to the preference of phone users. Also, from the graphs in finding #2,3,4, we notice that there are huge amount of participants chose -9(Don’t know). However, they are potential voters that would vote in the federal election. These people create great uncertainty in this study. They are largely influence the result by skewing the data to -9(Don’t know). Which can be a explanation that why the Liberal Party supporting rate is low.
Weaknesses and Next Steps
The weaknesses of this study is that this is only the ces2019 phone survey. There is also a ces2019 web survey. By only analyzing the data set from ces2019 phone survey is not sufficient enough to criticize this survey and test the reliability. In the future, we can combine the result from ces2019 phone survey and ces2019 web survey to create a more comprehensive data set. Also, we cam filter the choice -9(Don’t know) to avoid the skewness of the data set.
References
October 21, 2019 Federal Election Election Results. (n.d.). Retrieved September 23, 2020, from https://enr.elections.ca/National.aspx?lang=e
Allaire, JJ, Yihui Xie, Jonathan McPherson, Javier Luraschi, Kevin Ushey, Aron Atkins, Hadley Wickham, Joe Cheng, Winston Chang, and Richard Iannone. 2020. Rmarkdown: Dynamic Documents for R. https://github.com/rstudio/rmarkdown.
Hodgetts, Paul A., and Rohan Alexander. 2020. CesR: Access the Ces Datasets a Little Easier.
R Core Team. 2020. R: A Language and Environment for Statistical Computing. Vienna, Austria: R Foundation for Statistical Computing. https://www.R-project.org/.
Wickham, Hadley, Mara Averick, Jennifer Bryan, Winston Chang, Lucy D’Agostino McGowan, Romain François, Garrett Grolemund, et al. 2019. “Welcome to the tidyverse.” Journal of Open Source Software 4 (43): 1686. https://doi.org/10.21105/joss.01686.
Wickham, Hadley, Jim Hester, and Winston Chang. 2020. Devtools: Tools to Make Developing R Packages Easier.
Xie, Yihui. 2020. Blogdown: Create Blogs and Websites with R Markdown. https://github.com/rstudio/blogdown.